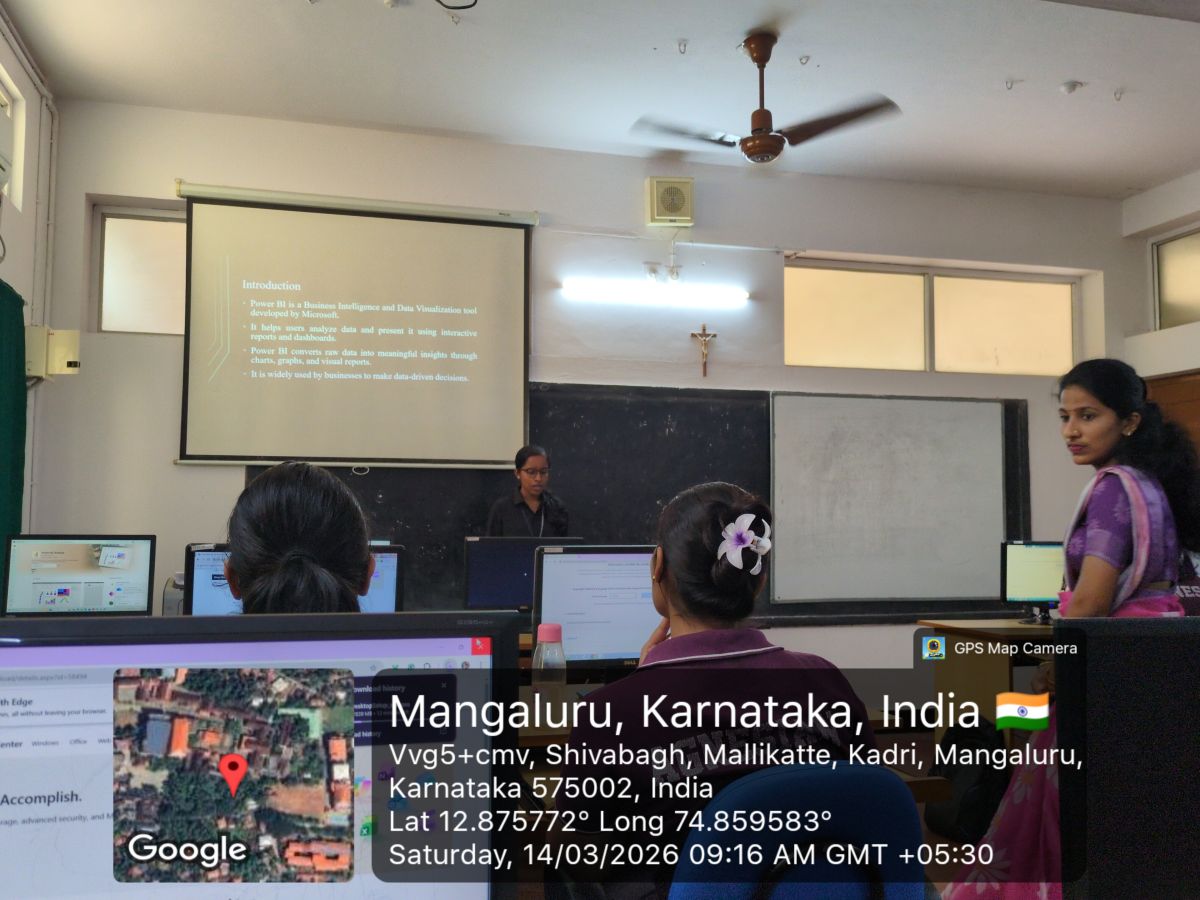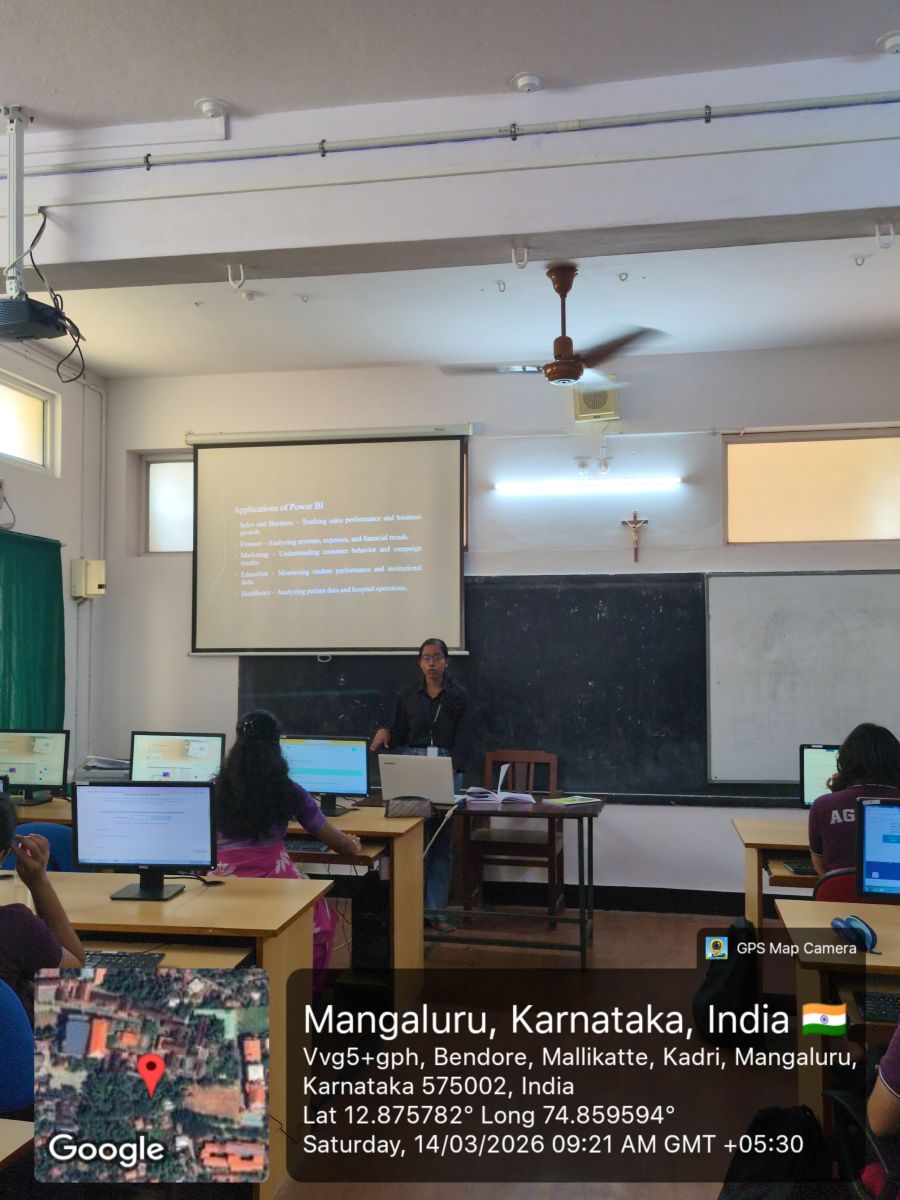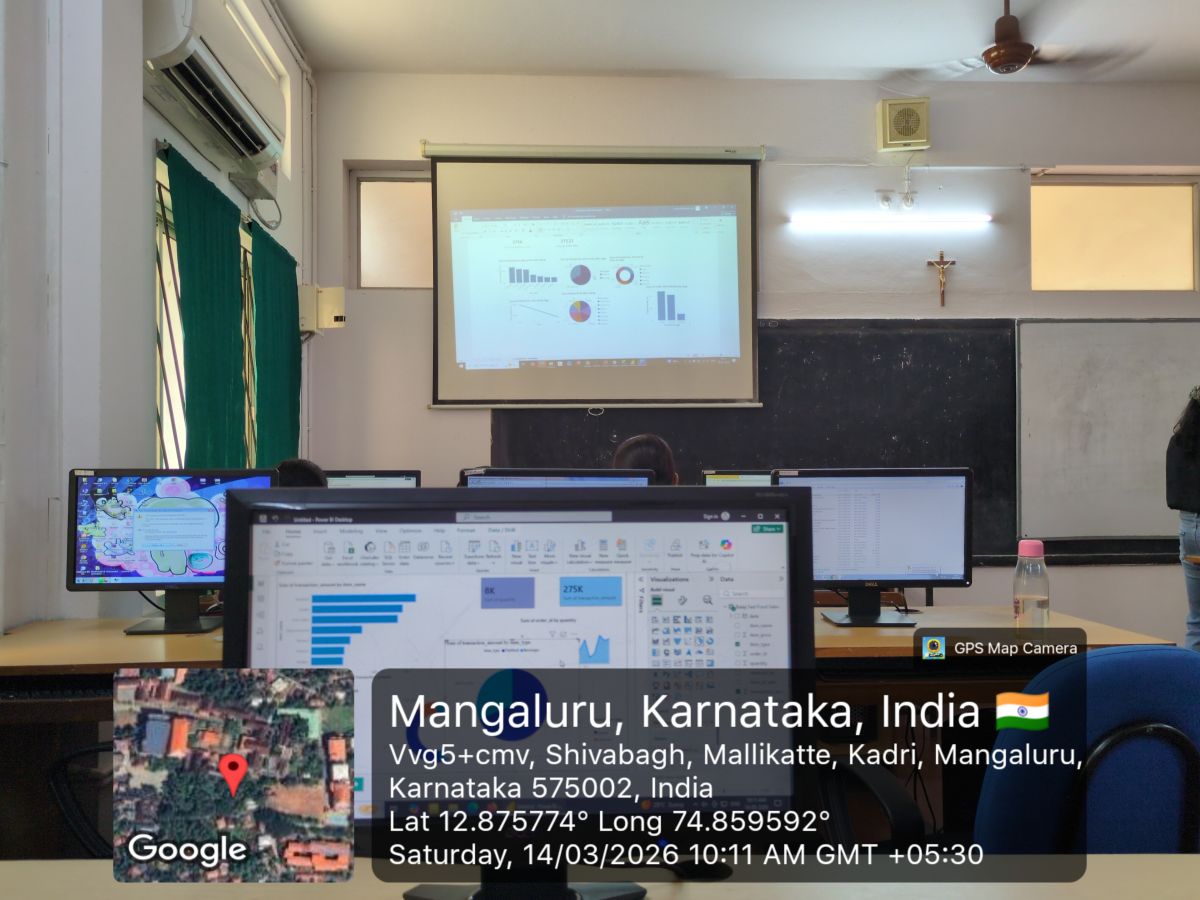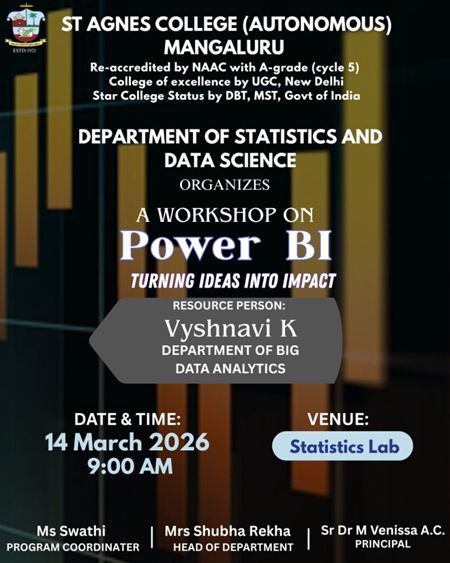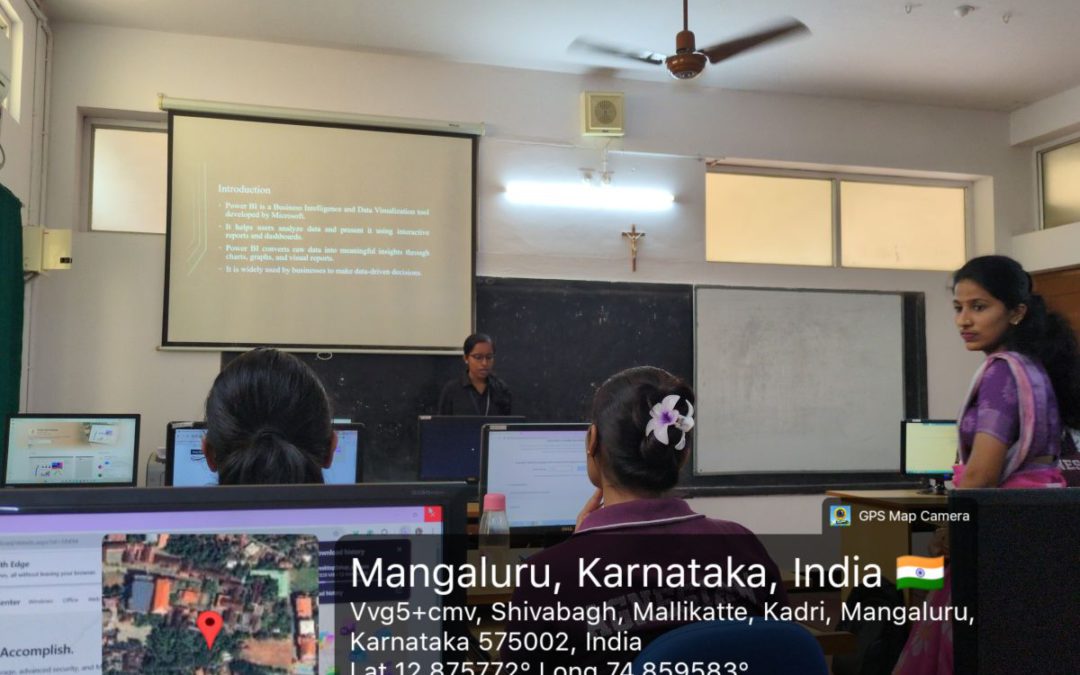
The Department of Statistics organized a Workshop on Power BI on 14 March 2026 at 9:00 AM in the Statistics Lab. The workshop aimed to introduce students to the fundamentals of Power BI, a powerful data visualization and business intelligence tool widely used for data analysis and reporting. The session was conducted by Vyshnavi K, a Big Data Analytics student from St. Agnes College, Mangalore. The workshop was attended by 15 final-year Statistics students from the Department of Statistics. During the workshop, the resource person introduced the students to the basic features and functionalities of Power BI. The session focused on how Power BI can be used to transform raw data into meaningful insights through interactive dashboards and visualizations. Vyshnavi K explained the process of importing datasets, cleaning data, creating charts, graphs, and dashboards, and generating reports using Power BI. Students were also introduced to different visualization tools such as bar charts, pie charts, line graphs, and tables that help present statistical data in a clear and effective manner. The workshop included a hands-on demonstration, where students actively practiced creating visual reports using sample datasets. The session helped students understand how data visualization tools can support statistical analysis and decision-making.